What Happens When a Health Dashboard Finally Understands the CSM?
From reactive firefighting to signal-driven clarity—helping Customer Success teams act before churn happens.


Video Walkthrough
🎬 Prefer watching the whole flow?
The Challenge
❌ Risk scores felt opaque—CSMs saw red, but not “why” ❌ Context was scattered across multiple screens ❌ No clear “next action” after spotting a risk ❌ CSMs spent unnecessary time switching tabs and tools ❌ No structured timeline of past activities or signals
Who was affected
👥 Customer Success Managers Needed a clearer story behind each account Wanted transparency about what changed and why 👥 Leadership & Sales Needed a better view of portfolio-level risk and opportunity 👥 Support Teams Needed context before escalation tickets were sent
Why it mattered
- Delayed responses → missed renewals - More escalations due to lack of clarity - Higher cognitive load for CSMs - “Reactive work culture” instead of proactive strategy
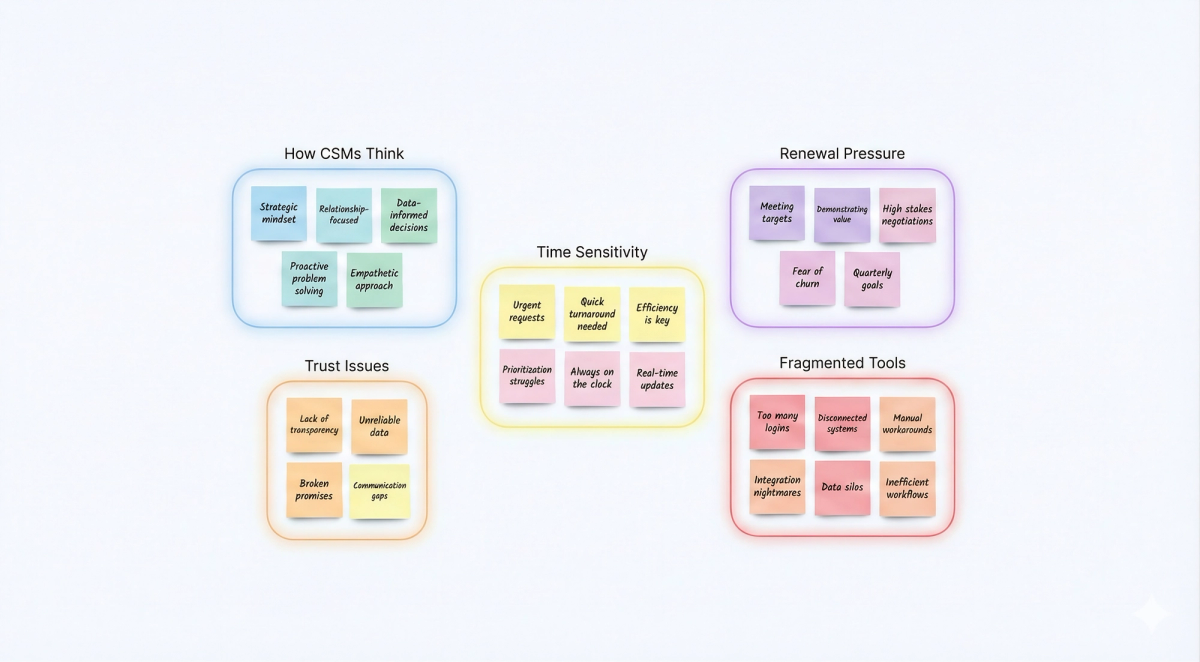
Research & Validation
CSMs work through stories, not screens. A score without context doesn’t help. It creates doubt. Risk isn’t static it shifts daily. Renewal timing changes what gets attention first. And every decision sits on top of what happened before.
Key insights:
72% of “critical” accounts had unexplained score drops 60% of CSM time is lost jumping between systems 90% of interviewees wanted a unified timeline combining signals + actions
“I don’t know what changed… only that the score dropped.”
Strategic Hypotheses

The Solution
✅ What it does
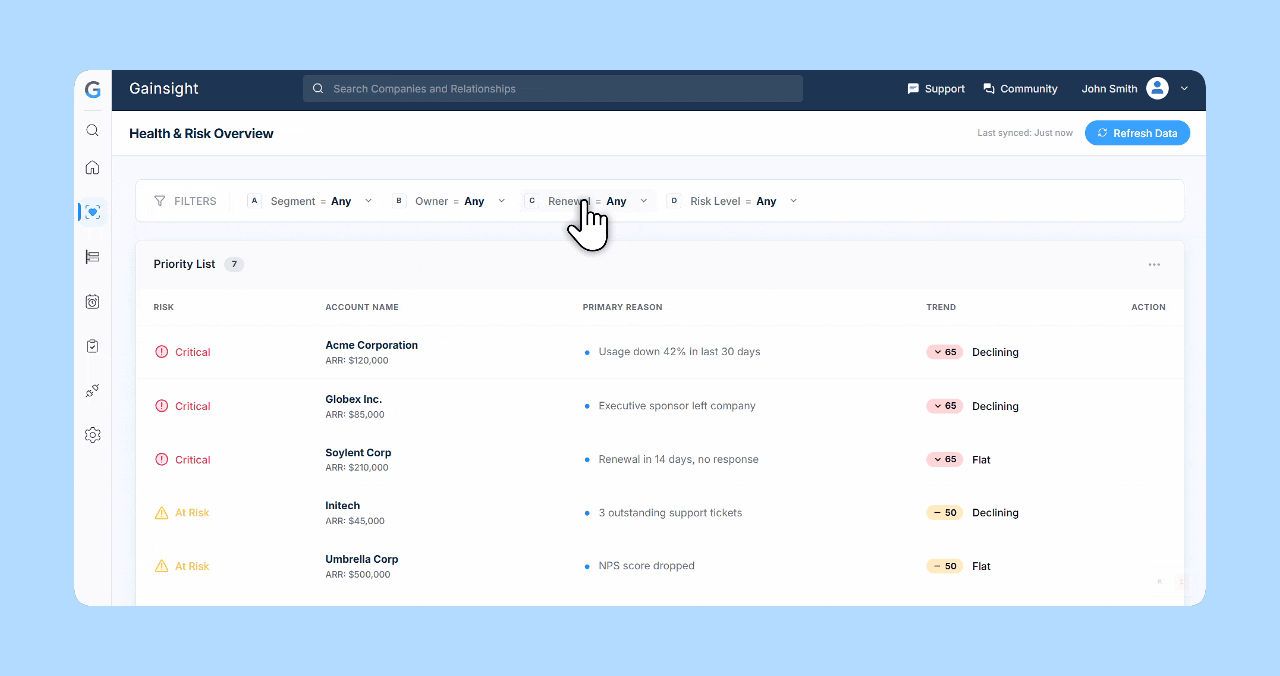
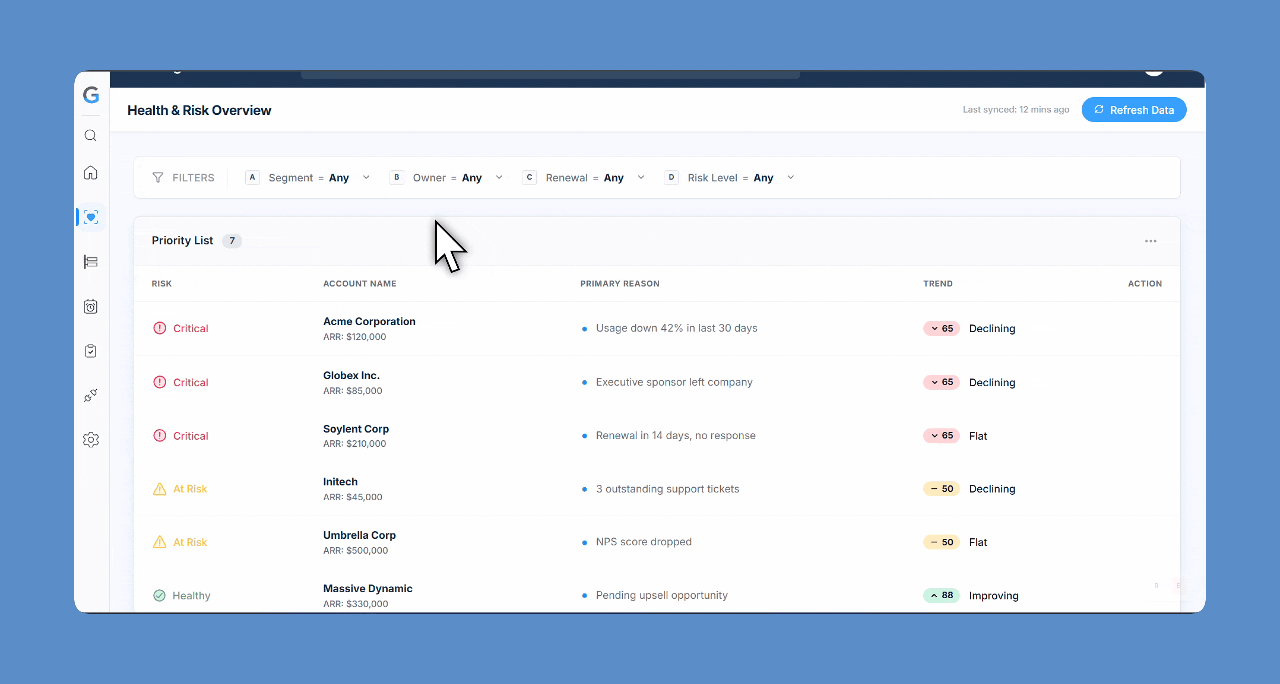
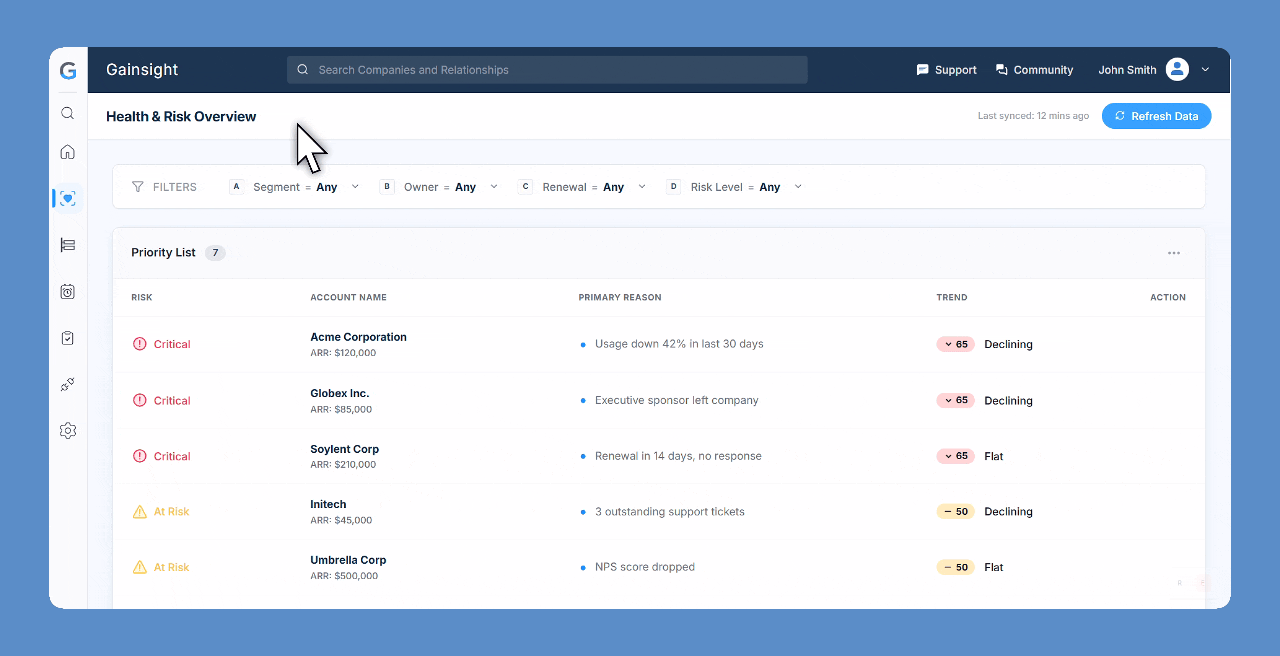
1. Health & Risk Overview Dashboard
- Shows top risks instantly - Highlights leading indicators - Surfaces expansion opportunities - Designed states: loading, healthy, filtered, no-data, error
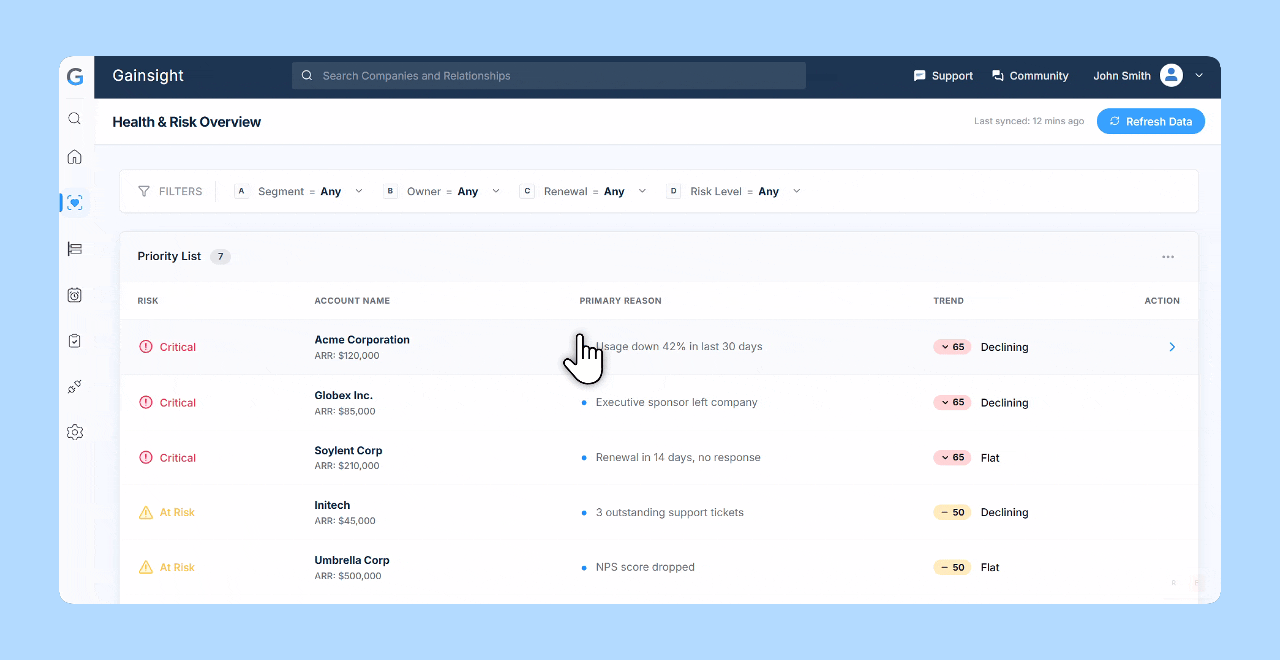
Which accounts need me right now?
2. Priority List
- Clear risk categorization (Critical / At Risk / Healthy) - Inline reasons (e.g., “Usage down 42%”) - ARR contextual, not overpowering - Trend direction added for clarity
This became the daily workflow hub for CSMs.
Designed for workflows, not UI
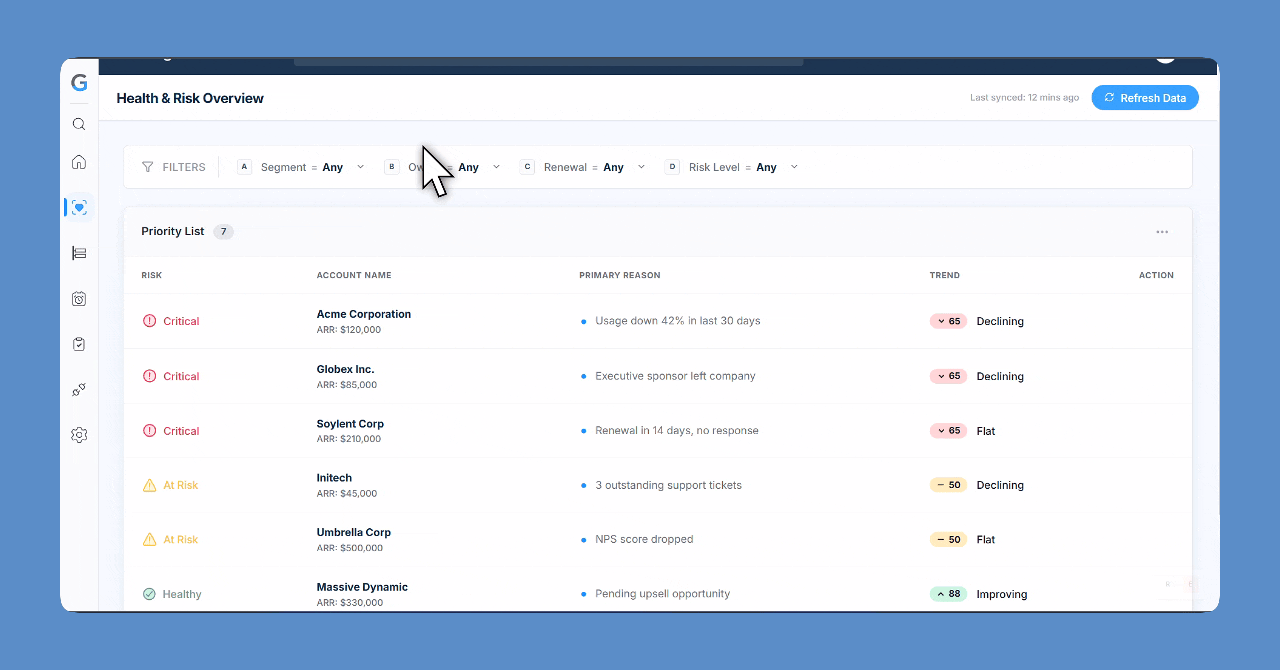
3.Filters (Segment, Owner, Renewal, Risk)
- Filters chain logically together - CSMs can narrow the list in seconds - Empty and no-risk states designed explicitly
Not just filtering data—filtering reality.
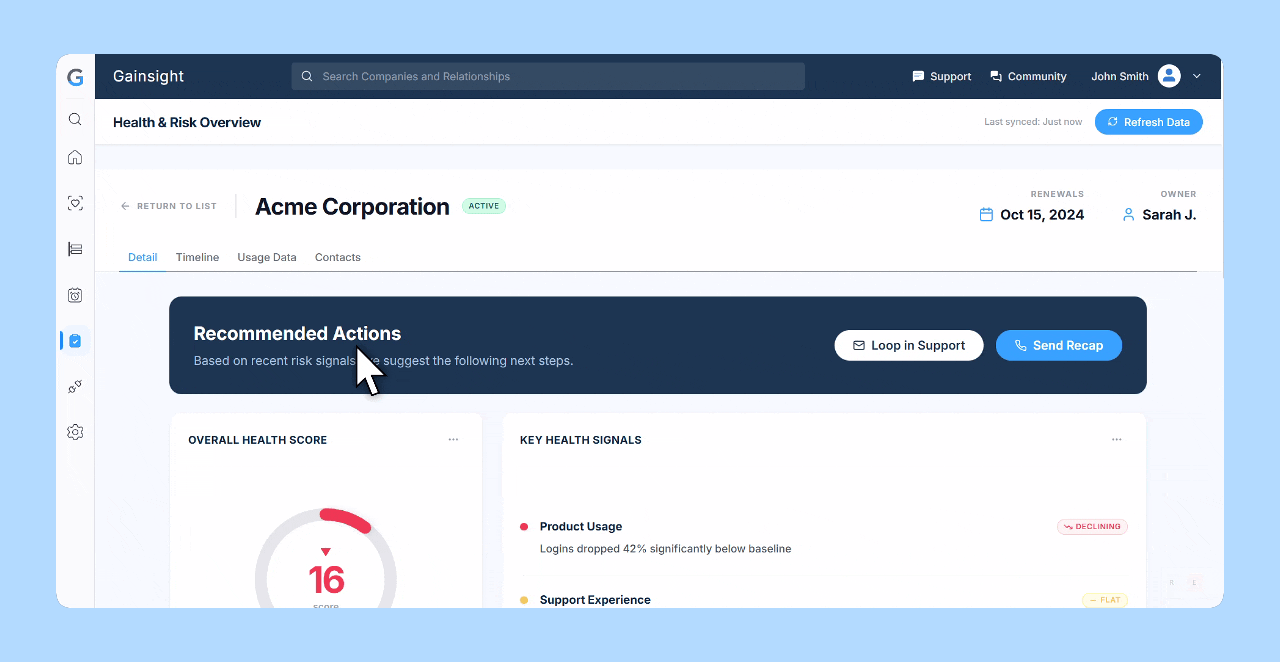
4. Account Detail View
A single place for: Health score, Key signals, Recommended actions, Account ARR + Segment, NPS score,Timeline history
Removes guesswork → increases response speed
Clarity over cosmetics
5.Health Score Analysis
- Weighted contributors (Support, Product Usage, Commercial Terms…) - Severity levels (Low / Medium / High / Critical) - 90-day history - Transforms a “mystery number” into a story.
6. Timeline & Activity Feed
Inspired by medical charts, CRM history, and incident timelines. Shows: - Meetings - Support tickets - Milestones - Sent recaps - Usage changes
This preserves account memory and reduces repeated work.
Collaboration & Constraints
Cross-Functional Syncs
Regulatory Constraints
- •Maintain Gainsight mental models
Technical Constraints
- •Scalable across Enterprise, Mid-Market, SMB
Real-World Impact
Faster Risk Identification
Reduction in Cognitive Load
Stronger Renewal Readiness
“This flow tells the story for me. I don’t need to hunt anymore.”
What I Learned
- ✨Health scores mean nothing without narrative
- ✨CSMs value clarity over visual flair
- ✨Designing states (error, empty, loading) is critical
- ✨Real power comes from workflow understanding, not UI polish